
Layer 1 — Pulse
Live shift intelligence
See pacing, labor, leakage, comps, voids, and service exceptions while the shift is still running — not after the weekly recap.
Lunch pacingLIVE
Rev
$14.8K
Labor
28.4%
Pace
+6%
Loading...
We use cookies to improve your experience and analyze site usage.
Your data lives in 5–10 disconnected systems. Your team decides by gut while margins leak daily. That’s the tradeoff removes.
No credit card required
James K. upsell rate is 14% below shift average. Consider pairing with Sarah for the next 2 tables.
Repeat last Tuesday's happy-hour — it lifted covers 9%.
Table 12 seated 47 min with no entrée fired — nudge the kitchen.
THE PROBLEM
Every restaurant group we work with faces the same blind spots.
Not another dashboard to check. Sundae reads every shift, cover, and line item — and tells you the next right move while it still matters.
Replaces the delay between data and action: Excel exports · POS dashboards · BI dashboards · analyst queue · weekly review meetings
Same data. Faster decision. Better action.
Restaurants used to choose between speed, quality, and cost. Sundae was built to deliver all three at once — that's the entire point.
Connect your stack fast. Pulse updates through the shift, and Sundae Intelligence answers with sources instead of sending teams back into the report queue.
Sundae ships with 500+ governed restaurant data models, peer-anchored benchmarks, and source-cited AI answers — so teams are not building from a blank BI canvas.
BI licenses are only the visible cost. The real spend is analysts, integrations, custom models, dashboard upkeep, and delayed decisions. Sundae is restaurant-ready from day one, with Report Lite free to start.
That's not a tradeoff. That's your operating advantage.
WHAT YOU RETIRE
Generic BI was built for analysts. Sundae was built for the people running restaurants.
One platform. Restaurant-native from day one.
6 LAYERS · ONE TRUTH
From the live shift to the long-range plan — one stack, six layers that talk to each other.
Real-time operations
Live pacing, adaptive targets, server performance, leakage — shift by shift.
Learn more →Competitive intelligence
Anonymous peer benchmarks across 30+ metrics. Know where you stand.
Learn more →Market intelligence
Competitors, weather, events — before they hit your numbers.
Learn more →12 analytics modules
Revenue, labor, inventory, marketing, delivery — each with AI recommendations.
Learn more →Conversational AI
Ask your data anything. Answers in seconds on web, Slack, or Teams.
Learn more →Predictive intelligence
14–90 day forecasts, what-if scenarios, exec briefings that correct themselves.
Learn more →
Live pacing, labor, and exceptions across every outlet — so the call you make at 7pm is the right one, not the one you second-guess at midnight.
Dashboards show what happened. Sundae adds the live operating context, market signals, and peer comparisons restaurants need to decide what to do next.
See pacing, labor, leakage, comps, voids, and service exceptions while the shift is still running — not after the weekly recap.
Add the market around each restaurant: weather, events, competitor pricing, footfall signals, and daily briefings your BI stack does not naturally know.
Compare locations against anonymized peers by format, market, and performance metric. The network gets more useful as more restaurants join.
Not another dashboard. A restaurant intelligence layer.
Sundae connects performance, plan, market context, and next action — so teams can move before the shift is over.
Lunch revenue is pacing 14% behind plan.
Illustrative scenario based on Sundae capabilities.
Average check is steady, so the issue is traffic — not pricing.
From signal to cause to action — before the shift ends.
INTELLIGENCE MODULES
Every dimension of restaurant performance — surfaced as a decision, not a chart. Benchmarked against your real cohort, ranked by margin impact, and routed to the right person on the floor.
4 modules
5 modules
3 modules
3 modules
3 modules
3 modules
2 modules
2 modules
2 modules
3 modules
3 modules
Correlation engine
By the time the weekly recap lands, the bad shift is over and the margin is gone.
Pulse shows you which location needs help right now — pacing, labor, leakage, all updated through the shift.
QSR, casual dining, fine dining, cloud kitchens, and hospitality groups inform the intelligence layer restaurants actually need — from single-shop operators to multi-brand portfolios.

Patterns we hear from operators and see across restaurant reporting workflows. Anonymized and generalized.
Teams wait 2–3 days for reports, exports, or analyst follow-ups. By the time the answer arrives, the shift has already happened.
Sundae Intelligence gives teams source-cited answers in seconds, across the systems they already use.
Voids, comps, discounts, and POS exceptions are small on their own. Left unreviewed, they can create between 1–3% of revenue and margin leakage.
Pulse flags exception patterns during the shift, attributed to the server, daypart, location, or behavior driving them.
Margin variance is often explained at month-end, after the costs are already booked.
Insights connects revenue, labor, food cost, discounts, and pricing so teams can see the cause while it is still actionable.
*Refresh frequency varies by Core tier. See pricing for details. †12 analytics modules across the platform; 12 specialized modules included in the current pricing bundle. ‡Industry observations are general restaurant-industry patterns drawn from public research and advisory feedback. Named pilot results and validated customer outcomes will replace this section as they become available.
BUILT ENTERPRISE-GRADE
SEE THE PRODUCT
Four surfaces from across the platform. Click any to enlarge — then explore the full gallery on each product page.
Bird's-eye view: 78/100 health, 10 open alerts, Revenue 93 / Labor 100 / Inventory 73 scorecards. "Food cost variance at 19.2% exceeds 5% critical threshold."
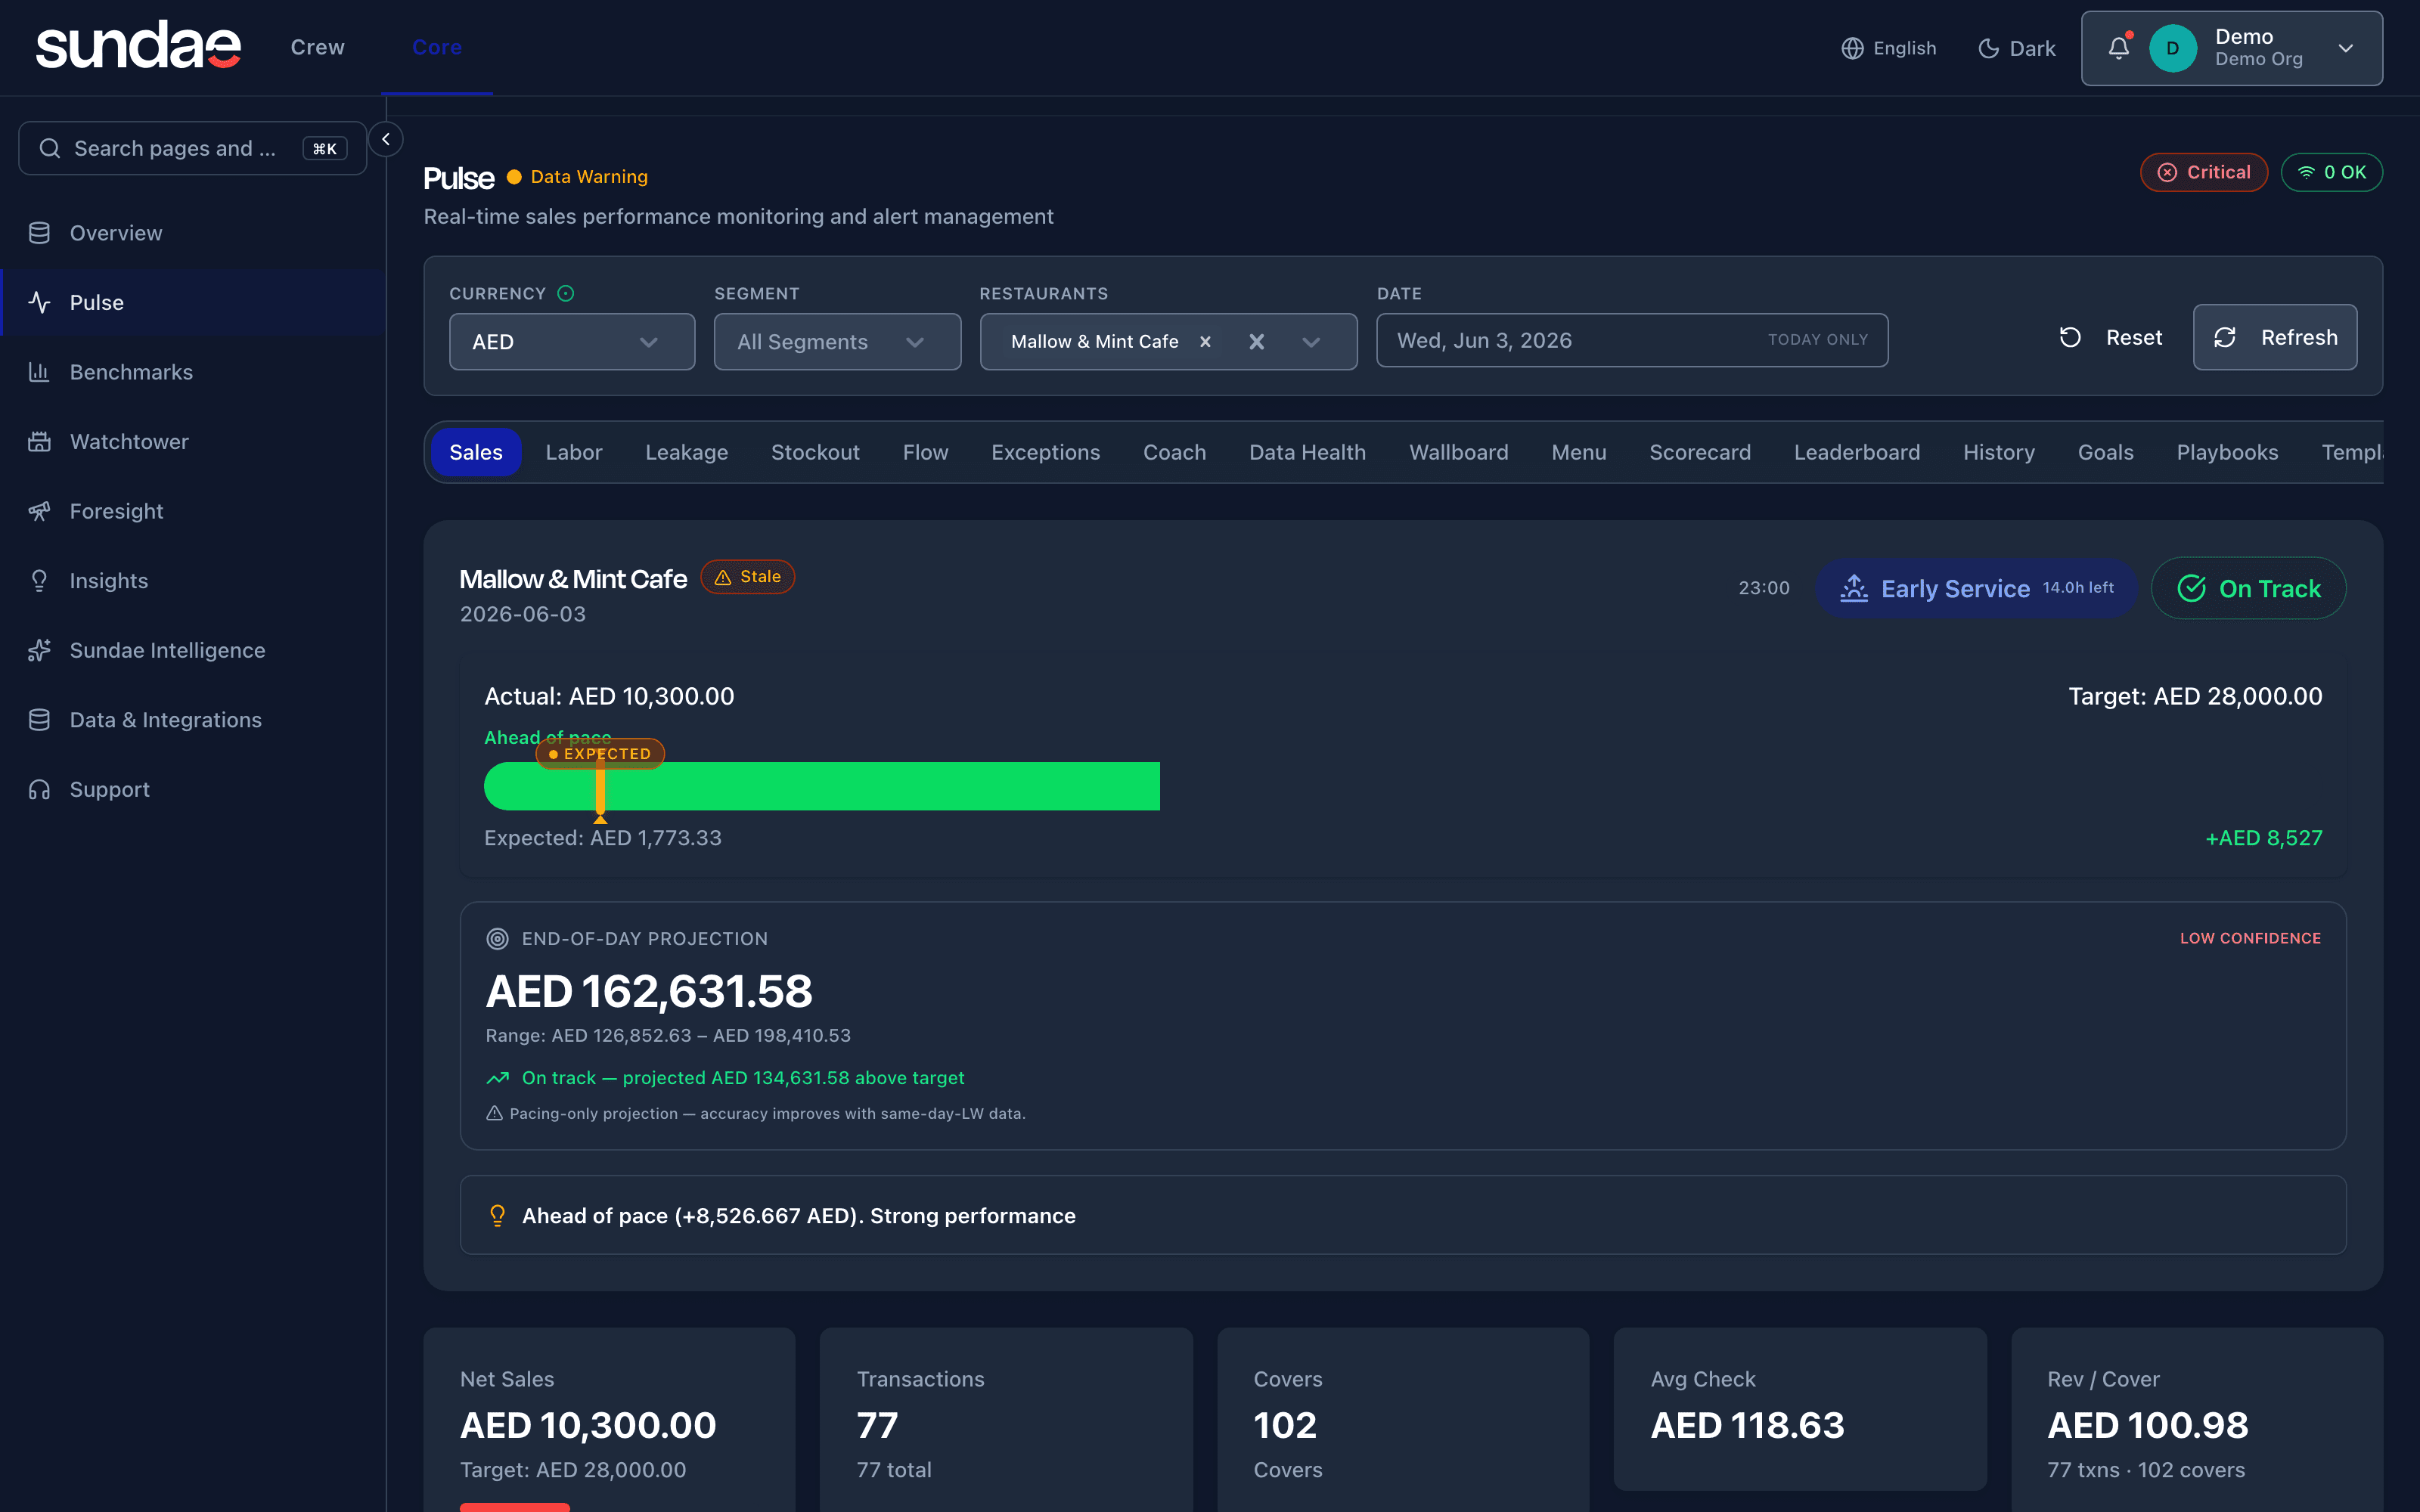
See full Insights gallery →Actual AED 10,300 vs Target AED 28,000. "Need AED 9,133.21/hr to hit target." 37% progress with outlet selector + behind status indicator.
See full Pulse gallery →5 scenarios saved, 10 quick-start templates (5% Price, 10% Labor Reduction, Marketing Push, Peak Season, Capacity Expansion). Sidebar: PREDICT / MODEL / TRUST / DECIDE.
See full Foresight gallery →AED 96,555 today's revenue, 379 orders, "New York Strip (40 sold)." Threads sidebar with Collections + suggested questions. Conversational decision intelligence.
See full Intelligence gallery →Live in-product surfaces. Synthetic data shown for illustration. Take the Operations Diagnostic to see what your view would look like.

Sundae gives you the read on your business that great instincts deserve — across every outlet, in real time.
30 minutes. Your data. What Sundae would actually change for the team.


